How many times are you asked to produce results for the projects you invest in and spend countless hours trying to prove you were justified in your recommendation? With new enhancements to the “kWh360” Energy Efficiency Management Suite, this is as simple as clicking a few buttons.
We provide 3 different ways to track your results, through simple graphs and charts.
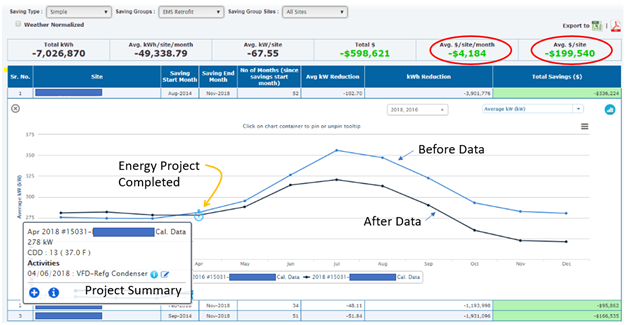
- The simple method compares before and after, weather-normalized, utility data.
- The enhanced method accounts for multiple projects, so you don’t double count the savings.
- The overall method looks at all site projects over many years, for total site savings.
For additional information, contact us at: info@Singh360.com